Gold and Silver Price Forecast: Navigating Precious Metals and Beyond
Gold just pierced the 4100 level and bounced. Many people think this means the bottom is in, but the charts tell a different story. While metals usually protect you from government debt and printing, the short-term trend is still leaning down. This analysis looks at where gold and silver are heading and why you might want to wait for a better price before buying more.
Gold Market Analysis: Charting the Downtrend and Future Rebound Potential
Identifying the Parallel Channel and Key Pivot Points
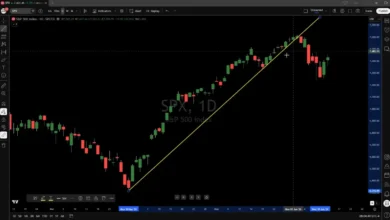
To see where gold is going, we start with a clean chart. By connecting the high and low pivot points, we can draw a parallel channel. This tool shows a clear downtrend. It maps out a ceiling and a floor that the price bounces between.
The 4100 level acted as a recent low pivot. Gold dipped below it, which is common, and then bounced back. While that bounce feels good, it doesn’t change the overall downward path of the channel.
The Psychology of Down-Sloping Parallels and Breakout Potential
Down-sloping channels don’t last forever. Statistically, these patterns usually break to the upside eventually. However, it takes time. You typically see the price hit the top trend line three times before a real breakout happens on the fourth or fifth try.
Right now, gold hasn’t hit that ceiling enough times. We need to see more tests of the upper line before we can expect a major move up. Until then, the odds favor the downtrend.
Intermediate Price Targets and Resistance Levels
Expect some short-term movement upward. The price could rally toward the 4300 to 4400 range. This is based on current chart patterns and recent bounce strength.
Don’t mistake this rally for a trend reversal. Once gold hits that 4400 area, it will likely set up for another test of the 4100 level. It might even break through that floor on the next drop.
The Long-Term Downside Target and Consolidation Phase
The bigger target is much lower. Look for gold to eventually hit the 3500 to 3600 range. This won’t happen overnight. Markets need time to digest big moves, and patterns need to mature.
A real breakout from this down-sloping parallel might not happen until 2027. Gold needs a year or more of consolidation. It needs a big enough drop to wash out the people who bought in for a quick profit.
Gold’s Correlation with Risk Assets: A Sign of Speculative Excess
There is a problem with how gold is trading right now. Last week, the stock market fell and gold fell with it. When the stock market bounced, gold rallied. This is the opposite of how gold should work.
For thousands of years, gold has been a safe haven. It usually moves opposite to stocks. When it tracks the stock market, it means there is too much speculative money involved.
Flushing Out Speculative Money and Weak Hands
The fact that gold is trading like a risk asset is a bearish signal. It shows that “weak hands” are holding the metal. A market correction is needed to flush these speculators out.
It is hard to hear that gold might drop when you want it to go to 10,000. But being a realist is better than having your head in the sand. The market needs to clear out the gamblers before a true bull run starts.
Silver Market Analysis: Support Levels, Resistance, and the 50-54 Target Zone
Analyzing the 64-66 Support Level
Silver recently hit a support zone between 64 and 66. As expected, this triggered a bounce. But there is a hidden weakness here.
Even though silver didn’t make a technical lower low, it had its lowest daily close since the bull move started. That is a nuance that traders should watch. It shows that sellers are still in control of the closing prices.
Identifying Near-Term Resistance and the 71-72 Target
If silver rallies, the first major wall is at 71 to 72. This is a key resistance area. If the price can’t break above 72, the path leads back down.
A break above 72 would open the door to higher trend lines. However, that is unlikely in the near term. The most important thing to watch is whether 64 breaks first or 72 breaks first.
The 54 Support Level and its Rationale
If silver drops, the next obvious stop is 54. This level is clear on the chart because it aligns with previous high pivots. It acts as a natural floor where buyers often step in.
The Intriguing 50 Target and Human Emotion
The 50 mark is a huge psychological level. Silver hit this high back in 1980 and again in 2011. Even though inflation makes 50 seem too low today, human emotion drives the chart.
When investors see a big round number like 50, they panic. This causes a “wick” or a tail where the price plunges through 50 before snapping back. This panic creates a massive discount for long-term buyers.
Copper and Other Commodities: A Brief Market Overview
Broken Trend Line and Bearish Bias
Copper has broken a key trend line. It is now hitting the upper end of its long-term parallel channel. This creates a lot of resistance.
While a breakout is possible, you have to respect the trend lines until the price proves otherwise. For now, the bias for copper is slightly bearish.
Platinum Buy Zone and Palladium Entry
Platinum is getting close to a buy zone. Look for prices to drop below 1600, ideally toward 1500. That is where it becomes attractive.
Palladium has already hit the first buy zone. This is a good spot to dip a toe in the water. It is a low-risk entry point for those looking to start a position.
Oil’s Critical Pivot and Trading Strategy
Oil has a critical pivot point at 83 to 84 dollars a barrel. If it closes below this on a daily basis, we could see a flush down to 67.
At 67, oil becomes a buy. If the Strait of Hormuz officially opens and a deal is signed, oil will likely dip to 67 before bouncing back to the mid-70s. This happens because countries will start buying for their strategic reserves.
Investment Strategy: Prudent Approaches to Precious Metals
Waiting for the “No-Brainer” Buy Level
If you already own gold and silver, be patient. You don’t need to buy at 4200 when you can potentially buy at 3500. Wait for the “no-brainer” price.
If you don’t own any metals, buying a small amount now is fine. But for those with a core allocation, waiting for the dip is the smarter move. Missing a bottom is not the end of the world as long as you already have a position.
The Importance of Realism Over Wishful Thinking
Avoid the trap of wishful thinking. It is easy to ignore bad signals because you want the price to go up. That is how investors lose money.
Be a realist. Embrace the truth of the charts even when it is not what you want to hear. This keeps you from being fooled by short-term bounces.
Final Thoughts
Gold and silver face downward pressure in the near term. The technicals show a downtrend, and the correlation with the stock market suggests too much speculation. While metals remain the best alternative to failing fiat currencies, the timing for big buys isn’t here yet.
Keep an eye on 4100 for gold and the 64-66 zone for silver. If gold hits 3500 or silver hits 50, those are the moments to act aggressively. For now, hold your positions and watch for a real breakout, likely not until 2027. Stay disciplined and wait for the discount.