S&P 500 and NASDAQ Analysis: Unpacking the Potential Head and Shoulders Pattern and the SpaceX IPO Impact
The S&P 500 and NASDAQ just took a hit. Friday was a bloodbath and the NASDAQ dropped nearly 5%. Many traders are now wondering if we are seeing a simple dip or the start of a massive crash.
The big question is whether the market is heading for new all-time highs or if a major top is forming. A huge catalyst is looming: the SpaceX IPO. This event will likely dictate how big banks handle the market in the short term.
We are going to look at the charts to see what is happening. We will analyze price action, institutional goals, and specific patterns that could signal a trend change for both the S&P 500 and the NASDAQ.
Recent S&P 500 Price Action and Trendline Break
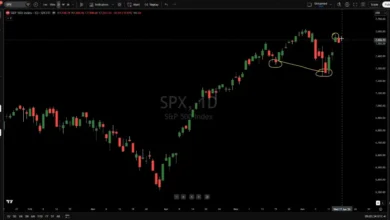
The S&P 500 recently broke a key trendline. When this happens, we usually see a bigger pullback. The price action has looked weak. Even on days when the market opened higher, it struggled to stay there.
Analyzing Friday’s Drop and Monday’s Weak Rebound
Friday was a sharp drop that spooked a lot of people. Monday saw a small bounce, but it was muted. The market closed near its daily lows, only up about 0.3%. This shows that buyers aren’t stepping in with any real conviction.
The Significance of the Upcoming SpaceX IPO
The SpaceX IPO is coming up this Friday. Big firms like Goldman Sachs, BlackRock, and Morgan Stanley are the bookrunners. They need to find buyers for these shares. For this to work, they need retail investors to feel bullish.
If the market crashes right before the IPO, people won’t want to buy. The bookrunners want a successful first day. A stock that opens and then tanks all day looks bad for the banks. It also scares off other companies like OpenAI or Anthropic that might want to go public.
The “No Market Collapse Before IPO” Thesis
Institutions have a strong reason to keep the market steady. They won’t let the S&P 500 collapse before Friday. It is simply bad for business.
Institutional Motivation: Ensuring IPO Success
Underwriters need high demand to keep the price up. If the general mood is bearish, the IPO fails. To prevent this, the big players will likely keep the market floating. They need a steady environment so the launch looks like a win.
Managing Market Fluctuations vs. Preventing Major Dumps
The market can still move down a little bit. A small drop of 0.25% is fine. But another 5% crash like we saw on Friday is what they want to avoid. They want to stop a panic that kills the appetite for new shares.
Identifying the Potential Head and Shoulders Pattern
If the market stays flat or goes up for a few days, it might create a specific shape. This is where technical analysis comes in.
The Left Shoulder and the Head
A head and shoulders pattern starts with a peak, called the left shoulder. Then the price drops and rises to a higher peak, which is the head. We have already seen these two movements in recent weeks.
The Emerging Right Shoulder and Mid-Week Reversal
Now we watch for the right shoulder. If the market bounces for three to five days and then curls over mid-next week, the pattern is complete. This would create a peak that is lower than the head.
Understanding the Head and Shoulders Pattern Mechanics
This is a classic reversal pattern. It tells us that the buyers are losing strength.
Defining the Neckline and Target Calculation
The neckline is the support level connecting the lows of the shoulders. To find the price target, you measure the distance from the top of the head down to the neckline. Once the price breaks below the neckline, you project that same distance downward.
Interpreting the Pattern’s Target Alignment
The calculated target for the S&P 500 aligns with a previous base of consolidation. When a pattern target hits a known support zone, it makes the signal much stronger. It gives the trade a logical end point.
The Implications of a Head and Shoulders Breakdown
A break below the neckline changes everything. It means the current uptrend is over.
From Uptrend to Short-Term Downtrend
An uptrend is defined by higher highs and higher lows. If the right shoulder forms, we get a lower high. If the neckline breaks, we get a lower low. That shift officially starts a short-term downtrend.
Parallels with Gold and Silver Market Movements
We saw this happen recently with gold and silver. They had huge runs to the upside. Once they started making lower highs and lower lows, the price action turned weak and stayed that way. The stock market could follow the same path.
The Role of Exit Liquidity and Institutional Profit-Taking
Institutions don’t just want the IPO to look good. They need to sell their own shares.
Maintaining Market Stability for Exits
Insiders and employees often sell shares when a company goes public. The big banks also want to take profits. They need “exit liquidity.” This means they need plenty of retail buyers to buy the shares they are selling.
Calculating Downside Targets with Data
Using data helps you ignore emotion. Whether you are bullish or bearish doesn’t matter. The chart shows the levels. By tracking the head and shoulders pattern, you can set a hard target for where the market might land.
NASDAQ Analysis: The QQQ and Similar Patterns
The NASDAQ 100 (QQQ) is behaving almost exactly like the S&P 500. It is even more volatile.
Recapping the QQQ’s Recent Performance
The QQQ broke its parallel trendline during the big flush. Like the S&P, it closed neutral on Monday. It failed to reach its previous highs, confirming a lack of strength.
The Head and Shoulders Pattern in the QQQ
The QQQ is also forming a potential head and shoulders. It has the left shoulder and the head. If it bounces now and then falls, the right shoulder will be set.
Advanced Market Observation: Lower Highs and Pattern Confirmation
Experienced traders look for multiple signals. One signal is a guess; three signals are a trade.
Prioritizing Data Over Emotion in Trading
Emotion leads to mistakes. I have traded for two decades and still make bad calls. The difference is that I follow the data. When I let emotion in, my win rate drops.
Defining the QQQ’s Neckline and Potential Targets
The QQQ neckline is clearly visible on the chart. If we measure from the head to the neckline and project it down, the target lands in a zone of sideways chop. This is where the price is likely to settle.
The AI Stock Landscape and Micron’s Case Study
The whole market currently depends on AI stocks. If AI fails, the indices fail.
Recent AI Stock Volatility and Rebound
Last Friday, some AI stocks dropped 10% or 15%. They bounced back yesterday and today. This rebound is likely part of the institutional effort to keep the market looking healthy for the IPO.
Micron’s Post-Upgrade Performance and Goldman Sachs’ Target
Look at Micron. It is trading near $1,000. Goldman Sachs just raised its price target from $400 to $900. The stock went up because people saw the word “upgrade” in the headline.
Deciphering Analyst Ratings and Institutional Signals
You have to read the fine print. The headline says “upgrade,” but the number tells the real story.
The Nuance of Goldman Sachs’ Micron Upgrade
Goldman raised the target to $900, but the stock is already at $998. This means Goldman actually expects the stock to go down over the next year. They likely expect margins to shrink as more supply hits the market.
Following the “Big Players”: Goldman, Morgan Stanley, BlackRock
Ignore the small firms with $3,000 price targets. Focus on the elite firms like Goldman and BlackRock. They have the most money and the best data. Their targets often signal where the big money is actually moving.
Final Thoughts
The S&P 500 and NASDAQ are in a precarious spot. We are seeing potential head and shoulders patterns on both indices. This suggests a top might be in.
Institutions will likely keep the market afloat until the SpaceX IPO on Friday. They need retail buyers to act as exit liquidity. However, this artificial support may just be building the right shoulder of a bearish pattern.
Stay focused on the data. Watch for lower highs and the break of the necklines. Keep a close eye on AI stocks like Micron and the actual numbers behind bank upgrades. Trade the chart, not your feelings.