Gold, Silver, and Copper Market Analysis: Navigating the Latest Price Swings
Gold and silver prices just surged. This move is strange because it happened while oil prices dropped and stocks climbed. Usually, you don’t see precious metals rally when risk assets like the S&P 500 are also catching a big bid. It makes the current setup feel a bit off.
Gold is usually a safe haven. Investors run to it when they are scared. Right now, it is moving in a “risk-on” fashion, meaning it’s rising alongside stocks. This challenges how we normally think about gold as a store of value. Technical analysis is the only way to make sense of this weird action.
I focus on the charts for gold, silver, and copper. By using pivots and trendlines, we can see where the market is actually heading. We can spot the traps and find the real buying zones.
Gold’s Recent Performance and Future Outlook
Gold is currently moving inside a large parallel channel. I track this by connecting high pivots to high pivots and low pivots to low pivots. This structure shows us the boundaries of the current trend.
The worst-case scenario for gold is a drop to around $3500. That is the bottom end of the channel. It would take several months for the price to hit that target, but it’s important to have that number on your radar.
The Gold-Oil Inverse Relationship and Stock Market Correlation
There is a clear link between gold and crude oil right now. For every single drop in oil, gold has seen a corresponding bounce. They are moving in opposite directions.
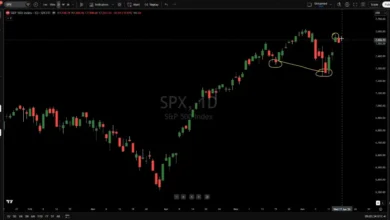
The stock market, specifically the S&P 500, is also behaving this way. While oil falls, stocks rally, and gold follows the stocks up. This coordinated movement is rare. It’s a strange time where gold is acting more like a growth asset than a hedge.
Near-Term Resistance and Support Levels for Gold
Traders need to watch specific price levels to avoid getting trapped. The first big test for gold is the $4400 to $4450 range. This area has acted as a rejection zone for several months. Many candles have wicked up into this zone but failed to close above it.
If gold can break and close above $4450, the door opens. It could then head toward the top of the larger parallel channel. That would be a strong bullish signal.
On the downside, we have to watch for confirmation. A simple dip below a level isn’t enough. I want to see a confirmed breakdown. Key support levels to watch include:
- $4100: The initial support zone where the recent bounce started.
- $4000: A psychological level.
- $3900: A pivot low area.
- $3500: The long-term channel floor.
The overall bias remains downward because we are seeing lower highs. It is more likely that gold hits $4400 and fails than it is to break out.
Silver’s Bounce and Accumulation Strategy
Silver has had a nice bounce lately. I pointed out the $66 to $64 level as a spot where a rally was likely. It happened exactly as planned.
Despite the bounce, the bigger trend is still down. Silver is making lower highs and lower lows. This pattern usually leads to another leg down. Many silver bulls hate to hear that, but it is what the chart shows.
Long-Term Thesis and Accumulation Zones
I hold gold and silver for the long term. To me, a price drop is just a gift. It allows me to buy more at a discount.
The long-term case for metals is based on fiat currency. Governments keep spending money they don’t have. Debt and interest payments are spiraling. Because of this, precious metals will go higher over the long haul. Short-term dips are just accumulation zones.
Key Support Levels and Dollar-Cost Averaging
I have a strict plan for buying silver so I don’t trade with emotion. I’m not buying more until it hits $50. If it goes lower, I just buy more.
Here are the levels I’m tracking for silver:
- $54: The first major support.
- $50: A key even number and buying trigger.
- $46: The critical pivot low.
I wouldn’t be surprised to see silver hit $46 in this cycle. My strategy is to dollar-cost average. Once silver hits $50, I’ll buy every five dollars it drops. This keeps me in control.
Copper’s Weak Position and Global Economic Indicator
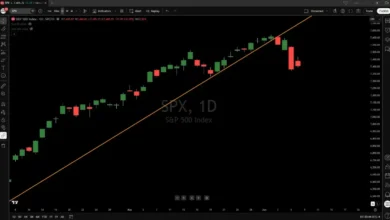
Copper looks very weak compared to the precious metals. It is currently sitting near the top of a large parallel channel. This is usually a sign that the price is overextended.
Copper also broke a key trendline recently. It tried to get back above that line a few times and failed. This is a bearish signal.
Limited Upside Potential and Significant Downside Risk
The risk-reward ratio for copper is poor. Even if it breaks the current trendline, it hits immediate resistance. There isn’t much room to profit on the upside.
The downside is much larger. Copper is a bellwether for the global economy. If we see a macro slowdown or a dip in data center builds, copper could crash. A drop to $5 is a real possibility.
Conditions for Neutral Stance
I am currently bearish on copper. I will only move to a neutral stance if the price confirms a break above the upper parallel channel. Even then, I wouldn’t be a buyer. I don’t buy assets that are already at high levels.
Platinum, Palladium, and Trading Opportunities
Platinum had a big bounce recently. It almost hit my buy zone, but it didn’t quite touch it. I missed the entry for the PLTM ETF, but that’s okay.
Palladium was a different story. It hit my target buy level perfectly. I bought the palladium ETF and took profits a few days later. That trade netted a 13% gain in less than a week. That is how you play commodities: find the pivot, enter, and bank the profit quickly.
I’ve also started a small short position on gold. I’m betting it will struggle at the $4400 level. I’ll add to that short if it reaches $4450.
For those who want these kinds of setups, I run “Gareth’s Top Squad” on YouTube. It’s a premium group where I share trade ideas and give members discounts on my options services and courses.
Final Thoughts
Volatility is a tool if you have a plan. Most people react with emotion when prices swing. They panic when things drop and get greedy when things spike.
The key is to have a roadmap. For gold and silver, the short-term trend is down, but the long-term trend is up. This means we use the dips to accumulate. For copper, the technicals are simply too weak to be bullish.
Use technical analysis to find your entry and exit points. Don’t guess. Whether you are hedging against currency devaluation or swing trading for a 13% gain, the charts tell the story. Stay disciplined, follow the pivots, and keep your emotions out of the trade.