Mastering Market Analysis: A Technical Trader’s Game Plan
I spent years as a losing trader before I stopped listening to the noise. I realized that logic and charts beat hype and narratives every single time. Once I mastered technical analysis, I turned my trading around and became a multi-millionaire. Now, I use those same data-driven techniques to build a trading game plan that removes the guesswork from investing.
Right now, the market is facing a storm of events. We have a Federal Reserve decision, stubborn inflation, and geopolitical tension affecting oil. Tracking these isn’t about guessing what will happen, but about reading the price action to see how the market actually reacts.
Decoding the Fed’s Next Move: Hawkish or Dovish?
The Federal Reserve meeting is a huge catalyst for price movement. While most people expect no rate change, the real story is in the vote count. If more board members vote for a hike than a cut, the Fed is “hawkish.” If they lean toward cuts, they are “dovish.” This distribution tells us exactly where the Fed is headed over the next few months.
Kevin Warsh’s first press conference adds another layer of risk. Warsh has a history of hating public communication tools like the “dot plot” and regular press briefings. There is a real chance he tells the public that the Fed will simply talk less.
If the Fed stops being transparent, the market might freak out. Traders hate uncertainty. We will be watching to see if he walks a fine line or takes a hard stance that spooks investors.
Charting the Course: Key Technical Indicators and Market Sectors
S&P 500 Futures (ES): Identifying Trend Changes
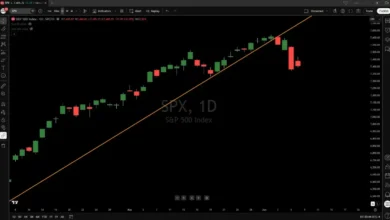
I stay glued to the daily S&P chart to find “breadcrumbs.” We recently saw a massive selloff followed by a weak bounce. To know if the trend is changing, we look for highs and lows.
A healthy market makes higher highs and higher lows. Right now, we have a lower low. If we follow that with a lower high, it confirms a change in trend. One bad day doesn’t make a pivot top, but a series of stalls could signal a cycle top for the entire S&P 500.
AI Semiconductor Sector (SOXX): A Leading Indicator
The semiconductor trade is the most powerful sector in the market. Fifteen companies here make up about 40% of the total US market cap. When semis move, the whole market follows.
Looking at the weekly SOXX chart, we see a “topping tail.” This happens when:
- The price hits a recent major high.
- The candle has a long upper wick.
- The price closes in the bottom 25% of the candle.
This is a bearish reversal signal. It only gets negated if a candle closes above that high wick. The key level to watch is 620 on the SOXX ETF. Since it is a short trading week, the market has very little time to prove this signal wrong.
Silver (SLV) and Gold: Analyzing Commodity Reversals
Silver provides a great example of how topping tails work. In the past, SLV hit all-time highs and formed a topping tail. Even though it opened higher the next day, it closed back below the signal. This led to a massive crash from 110 down to 69.
Gold is currently bouncing off the 4,100 support level. The next big resistance is a trend line connecting high pivots. If gold cannot break through the 4,400 to 4,450 zone, it is running out of energy.
For silver, I expect more downside toward 54 per ounce. I will become a heavy buyer once it drops below 50. Long-term, I am a bull on precious metals because government spending is reckless. However, short-term flushes happen when “ultra-bullish” narratives take over. Usually, when everyone is screaming “buy,” it is time to dump.
Deeper Market Dives: Interest Rates, Currency, and Specific Equities
The 10-Year Yield: Interest Rate Sensitivity
The 10-year Treasury yield drives mortgage rates and long-term borrowing. It is important to remember that the Fed controls short-term rates, not the 10-year yield.
We are watching a specific support level on the yield chart. If we break below the yellow line, rates will likely fall. If it holds as technical support, it could spook the stock market. Most investors want the Fed to fight inflation, but they don’t want them to be too aggressive.
The U.S. Dollar: Bull Flag or Breakdown?
The dollar is currently hitting a wall of resistance around 100. It keeps tagging the underbelly of that zone but cannot break through. This looks like a large “bear flag.” While the dollar might make one more attempt to move up, a breakdown is more likely.
SpaceX (STAR): Insider Lock-up Expirations
SpaceX is seeing a slow push up, but the risks are high. Insiders often have lock-up periods where they cannot sell shares. For SpaceX, if the price stays above 175 for five out of ten days, shares start unlocking.
There are roughly 70 billion dollars in shares that could be unloaded over the next 180 days. When “millionaire janitors” and cafeteria staff get their shares unlocked, they often cash out at least 50%. This creates massive selling pressure.
Tesla (TSLA): Wedge Pattern Analysis
Tesla is currently trapped in a wedge pattern. Wedges condense price into a tight range. When the price finally breaks out of a wedge, the move is usually violent and fast.
We saw this with oil recently. Oil formed a down-sloping wedge and then collapsed sharply. Tesla could either rocket to all-time highs or crash significantly depending on which side of the wedge it breaks.
Netflix (NFLX): Gap Fill and Double Bottom Potential
Netflix has been weak because investors prefer the AI trade. However, the stock recently filled a gap and is forming a double bottom. I am watching the 73 to 75 price range. This could be a great spot for a swing trade.
IGV (Technology Software Sector): Support and Rotation
Software stocks in the IGV have been under heavy pressure. But hedge fund managers cannot stay in cash for long because they need to make money for their firms. When one sector tops out, money doesn’t leave the market; it just rotates.
The IGV is sitting at a major technical support zone. We might see a gap fill around 8860, but I expect a bounce in software names soon as money rotates out of semiconductors.
Commodities and Cryptocurrencies: Current Outlooks
Oil: Geopolitical Factors and Potential Rebound
Oil has dropped toward 75 per barrel. I plan to start buying in small amounts below that level. There is a “14-point plan” for Iran that includes sanctions relief and 300 billion dollars for reconstruction.
This is a sweet deal for Iran, but the nuclear negotiations are still unsettled. If these deals fall apart over the next 60 days, oil could spike again. That risk makes the sub-75 area very attractive.
Natural Gas: Sideline Observation
I am staying on the sidelines for natural gas. There is a small cup-and-handle pattern, but nothing strong enough to trigger a trade. Until I see a clear signal, I am not risking capital here.
Bitcoin (BTC): Pullback and Support Levels
Bitcoin had a great rally from 59,000 up to 67,000. It is now in a small pullback. I expect it to retrace to the 64,000 to 64,500 range. If that level holds, the path to 75,000 remains open.
Final Thoughts
The market is at a crossroads. The combination of the Fed’s decision, Kevin Warsh’s communication style, and the potential for a semiconductor reversal creates a high-risk environment.
The most important takeaways are the 620 level on the SOXX, the trend changes in the S&P 500, and the lock-up expiration risks in SpaceX. Always remember that the “sexy” narrative—like the AI boom or silver shortages—is often a sign that a move is ending.
At Verified Investing, we stick to the charts. We don’t care about the hype; we care about the probabilities. Focus on the technicals, watch the support levels, and trade based on logic.